
Somewhere in Time: FDA Releases Its FY 2024 Report on Pharma Quality As Industry Looks to 2026
August 26, 2025As the summer of 2025 comes to a close and we begin to look toward to the 2026 Fiscal Year, FDA is completing its reporting on 2024. The FDA’s fiscal year 2024 Report on the State of Pharmaceutical Quality from CDER’s Office of Pharmaceutical Quality (OPQ) provides a look at the agency’s efforts under previous leadership to normalize its post-pandemic oversight. But the FDA and the pharmaceutical industry are in transition under the current administration, as new quality challenges have emerged across global supply chains. FY2024 ran from October 2023 through September 2024, so this report does not address the possible impacts of more recent policies, actual and proposed tariffs, and reductions in force at FDA. That said, this look back contains a number of interesting highlights.
Section One of the report examines the overall production site demographics and analyzes how they’ve changed in recent years. According to the report, 36% of registered sites are in the “No Application” sector, the majority of which are OTC monograph products, but also including marketed unapproved prescription drug products and homeopathic products. The remaining 64% of sites each manufacture at least one application product, including biological products licensed under Biologics License Applications (BLAs), products approved under New Drug Applications (NDAs), and generic products approved under Abbreviated New Drug Applications (ANDAs).
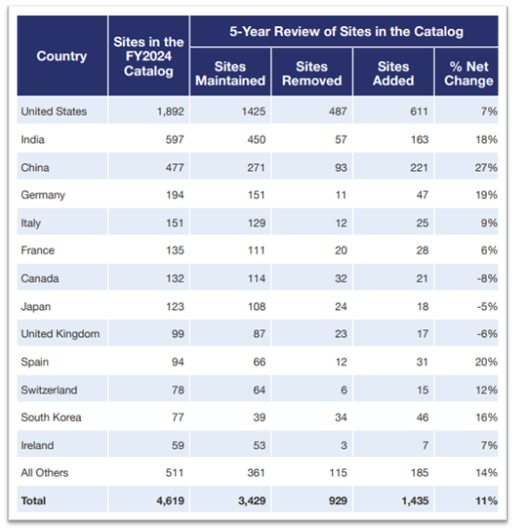
The six countries with the most sites in the FY2024 Site Catalog were the U.S., India, China, Germany, Italy, and France. Of note, since 2020, those nations had significant net increases in total listed sites, as seen in the chart below (here).
![]()
Five other countries, including China and India, increased registered sites more than 15%. Canada, Japan, and the U.K. each saw declines.
According to the Report, both domestic and foreign drug quality assurance inspections continued to creep up as well, though FDA is still well below pre-pandemic levels. There were over 1,300 inspections in FY2019, compared to 989 quality inspections last fiscal year. Perhaps in a nod to the recent Executive Order and announcement about FDA’s emphasis on foreign inspections, OPQ’s report boasted that “more than 62% of drug quality assurance inspections were at foreign sites —an all-time high. This progress in foreign inspections was particularly evident in India and China, where 34% and 28% of sites in the Site Catalog, respectively, were inspected.” In the 2023 report, we noted that roughly half of all inspections were at foreign facilities. We’ll keep an eye out for how this data might change if and when FDA’s foreign inspection policies evolve.
Section Two of the report examines drug product demographics, stating that CDER’s Product Catalog included 14,168 ANDAs, 3,625 NDAs, 383 BLAs, and 140,119 non-application product NDCs. All were increases from FY2023.
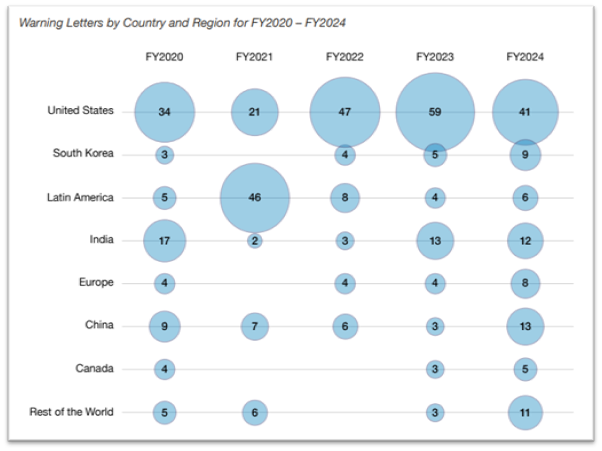
Section Three dissects FY2024’s enforcement matters, including import alerts, recalls, and Warning Letters. According to the report, FDA issued 105 Warning Letters for quality issues, the highest in five years. The report does not discuss Untitled Letters. Globally, 93% of all sites in the CDER Site Catalog have received no action indicated (NAI) or voluntary action indicated (VAI) as their most recent inspection classification. This data reveal an overall high level of compliance; however, classifications varied by global regions. Internationally, China, India, and South Korea were the leaders in quality-related Warning Letters (here).
![]()
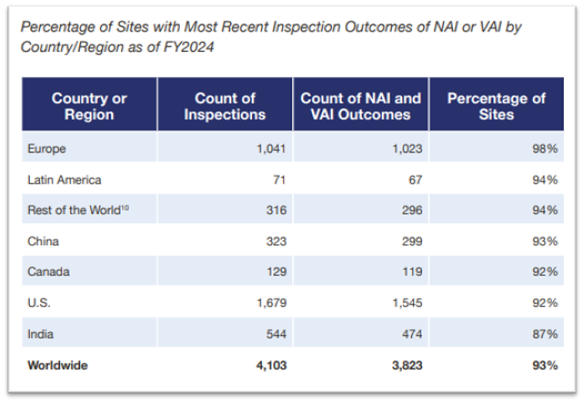
In terms of percentages, inspected firms in Europe led the global pack with a 98% NAI or VAI classification rate. China’s overall rate was 93%, and the U.S. rate was 92%. India’s overall inspection rate lagged at 87% of inspections classified as NAI or VAI (here).
![]()
Import alerts affected 75 sites, primarily OTC manufacturers and API suppliers. The report also reveals that over the last five years, 72% of enforcement actions against API manufacturers targeted sites exclusively supplying compounding pharmacies, though these sites represent just 18% of API manufacturers in CDER’s catalog. OPQ notes that because this small sub-group represents an outsized portion of enforcement actions, “FDA has prioritized these higher risk sites for future surveillance.”
Product recalls dropped to their lowest level in five years at 421 products, though contamination remained the leading cause. Ophthalmic products topped the recall list in terms of numbers, with several multi-product events involving sterility issues.
Looking at FDA’s FY2024 quality surveillance data provides a baseline for evaluating potential regulatory changes under the current administration’s reform agenda. The report’s discussions about FDA’s use of Warning Letters, emphasis on foreign manufacturing oversight, and API quality gaps all suggest areas where the agency’s approach might shift under the current leadership. And challenges with Chinese and Indian suppliers may align with Administration calls for domestic supply chain “reshoring,” and reduced dependence on foreign pharmaceutical manufacturing.
As we turn the calendar to FY2026, we’ll keep an eye on these trends to see how FDA’s assessment of 2024 will inform its future.